Published: 07-20-2026, 11:44 am
Key Takeaways
HSBC cut its 2026 average gold forecast to $4,560 from $4,864 on July 9, 2026, but left its year-end target unchanged at $4,750. That gap between average and target is the real signal.The structural drivers behind gold’s 2024–2025 bull run — sovereign de-dollarization, fiscal deficits, and central bank accumulation above 800 tonnes per year — were not revised in HSBC’s updated outlook.Central banks added 244 tonnes of gold in Q1 2026 alone — up 3% year-over-year and above the five-year quarterly average — buying through some of the highest gold prices in history. [World Gold Council]At 70:1, the gold-silver ratio sits above its 50-year average of roughly 65. Meanwhile, silver is entering its sixth consecutive year of supply deficit. [Silver Institute]For long-term stackers, the FOMC meeting on July 28–29 is noise. The structural case for precious metals does not rest on the next rate decision.
Sources: goldsilver.com/price-charts | Reuters (HSBC forecasts, July 9, 2026)
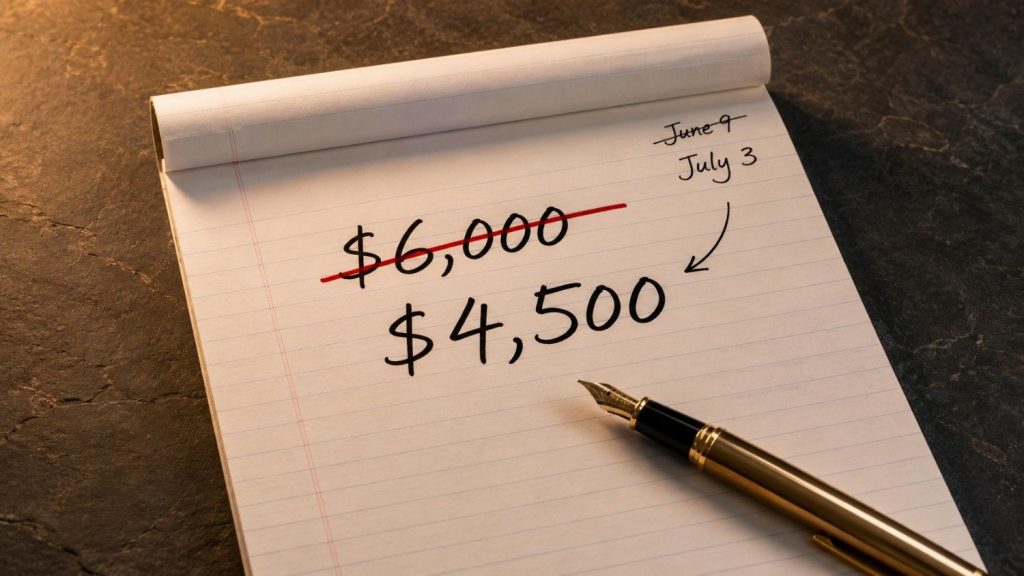
Gold’s HSBC gold price forecast headline looked rough on July 9, 2026. James Steel, HSBC’s Chief Precious Metals Analyst, cut the bank’s 2026 average forecast to $4,560 from $4,864 — a $304 reduction. Meanwhile, gold itself was hovering near $4,000, down roughly 28% from its January all-time high of $5,589.38.
However, Steel simultaneously left the year-end target untouched at $4,750. That distinction matters far more than the cut.
Furthermore, HSBC’s central bank demand forecast for 2026 — 680 tonnes — stayed unchanged. Its 2027 year-end target held at $5,025. Its 2028 and 2029 outlooks were not touched at $5,200 and $5,300 respectively.
In other words, the mainstream read the cut. HSBC was communicating something else entirely.
Why Do Rising Treasury Yields Push Gold Lower?
To understand HSBC’s contrarian conviction, you first need to understand the headwind the bank is acknowledging — and why it calls it temporary.
Gold pays no interest. Consequently, when US Treasury yields rise and investors can earn meaningful real returns on cash, the opportunity cost of holding gold increases. Specifically, the 10-year US Treasury yield has climbed to approximately 4.57% as of July 20, 2026. [US Treasury / MacroMicro] Inflation expectations hover near 2.3%, which implies a real yield above 2%. That is a genuine headwind for non-yielding assets.
Moreover, a hawkish Federal Reserve amplifies this dynamic through the dollar. Higher US rate expectations attract global capital into dollar-denominated assets. As a result, the US dollar has been trading near 13-month highs. A stronger dollar makes dollar-priced gold more expensive for overseas buyers, which suppresses demand and price.
So the near-term headwinds are real. HSBC’s Willem Sels and Lucia Ku acknowledged this directly in their July 2026 client note. “Our analysis indicates that US yields are the primary driver of gold prices,” they wrote. “We believe gold may remain range-bound in the near term amid elevated real yields and a stronger USD.” [Reuters]
That said, HSBC’s key argument is that these forces are already reflected in current prices. The bank now expects gold to trade between $3,800 and $4,700 for the remainder of 2026. [Reuters] Notably, gold is near the middle of that range today. In other words, HSBC is not calling for further collapse — it is calling the floor.
The 2022 precedent reinforces this view. Gold held above $1,800 through that entire year even as the Fed ran its most aggressive tightening cycle in four decades and real yields swung from deeply negative to meaningfully positive. Central bank demand absorbed the institutional selling. That relationship appears to be reasserting itself again.
The Knowledge That Changes Everything
2 Free Guides
Two essential guides — yours free. Understand why gold matters and why fiat currencies always fail.
Why Are Central Banks Still Buying Gold at These Prices?
The headline news has been about who is selling. The more important story is who has not stopped buying.
Central banks globally added a net 244 tonnes of gold in Q1 2026, according to the World Gold Council’s Gold Demand Trends report published April 29, 2026. [World Gold Council] That figure exceeded both the prior quarter and the five-year quarterly average. Sovereign buyers have continued accumulating through some of the highest prices in history — a pattern consistent with multi-year structural reserve diversification, not tactical trading.
Furthermore, a record 45% of central banks surveyed by the WGC in June 2026 plan to increase their gold reserves over the next 12 months. [World Gold Council] These are the institutions that issue fiat currency for a living. Their decision to hold gold is not a trade. It is a multi-year strategic allocation against systemic monetary risk.
Notably, HSBC did not revise its central bank demand forecast when it cut its average price estimate. It maintained its call for 680 tonnes in 2026 and 850 tonnes in 2027. [Reuters] That is structurally significant. Central bank buying provides a price floor that is not correlated with equity market sentiment or interest rate expectations. When institutional paper-gold sellers liquidate, sovereign buyers absorb the supply.
In addition, Asian retail demand has continued to accelerate. China’s gold ETF inflows led global demand in H1 2026, with Asian funds accounting for the dominant share of the $8 billion in net global gold ETF inflows during the first half of the year, even as North American funds saw outflows. [World Gold Council]
The split between Eastern buying and Western selling is not new. However, as physical gold migrates from Western exchange vaults into domestic reserves and Asian retail hands, the supply available to the paper market tightens. That tension does not disappear when Western ETF flows stabilize — it compounds.
What Does HSBC’s $4,750 Year-End Target Actually Tell You?
This is the number that the mainstream missed.
HSBC cut its 2026 average to $4,560. Simultaneously, it held its year-end target at $4,750. For traders and mining company CFOs focused on quarterly realized prices, the average cut matters. For a long-term holder who bought physical gold and plans to own it for years, the year-end target is what speaks.
Furthermore, HSBC’s Steel was explicit about what would drive the second-half recovery. He noted that heavy ETF liquidation from H1 2026 may partially reverse as structural supports reassert themselves. Specifically, those supports include rising fiscal deficits globally and ongoing sovereign debt market pressures. [Reuters]
Steel also addressed the geopolitical noise directly. “We do not believe Iran-related declines by themselves would be long lasting,” he said. [Reuters] In other words, the bank views the ceasefire collapse and its inflationary effects as cyclical pressure, not a thesis change.
Meanwhile, HSBC also stated in a late-June note that gold was “bordering increasingly on looking undervalued.” [ExchangeRates.org.uk] That language, combined with the unchanged year-end target, suggests the bank sees the current correction as a positioning opportunity rather than a structural breakdown.
Consequently, the true message from HSBC’s July 9 revision is this: the path got harder. The direction did not change.
For a physical gold investor, that is the essential distinction. A paper-gold trader cares about next week’s Fed meeting. A stacker who owns metal as a 5-year wealth protection strategy cares about whether the structural bull case remains intact. According to HSBC, it does.
Why Is the Gold-Silver Ratio at 70:1 a Signal, Not a Warning?
Silver has dramatically underperformed gold during this correction. The gold-silver ratio — the number of ounces of silver required to buy one ounce of gold — has expanded from near 55:1 in May 2026 to approximately 70:1 today. That marks a clear divergence, and it deserves an honest explanation.
Silver answers to two demand engines simultaneously. About 58% of total silver demand is industrial, according to the Silver Institute’s World Silver Survey 2026. [Silver Institute] Solar panels, electric vehicles, semiconductors, and data center infrastructure all require silver in ways that are not easily substituted. That industrial engine ties silver to expectations about global economic growth. When investors worry that elevated interest rates will slow growth, silver’s industrial demand outlook weakens alongside equity markets. That is precisely what has happened in July 2026.
Gold, by contrast, runs almost entirely on monetary demand. It does not benefit from economic acceleration and does not suffer as directly from slowdown fears. Consequently, when a central bank tightens aggressively, gold weakens on the yield side — but silver weakens on both the yield side and the growth side simultaneously.
However, this divergence is cyclical, not structural. The Silver Institute confirmed the sixth consecutive annual supply deficit for 2026, projected at 46.3 million ounces — wider than the 40.3 million ounce gap recorded in 2025. [Silver Institute, World Silver Survey 2026, April 15, 2026] Since 2021, cumulative above-ground stock drawdowns have reached 762 million troy ounces. [Silver Institute] That is nearly nine months of global mine production absorbed by industrial and investment demand combined, with no offsetting supply response.
Moreover, the 50-year average gold-silver ratio sits near 65. Ratios above 70:1 have historically corresponded to periods of silver undervaluation relative to gold. When monetary conditions eventually ease and silver’s industrial engine re-engages, the ratio tends to compress sharply.
The signal here is not that silver is broken. The signal is that silver is pricing in a permanent slowdown in industrial activity that the six-year deficit structure does not support. When those two realities reconcile, the ratio will compress. The only genuine uncertainty is timing.
What Should a Long-Term Stacker Do Right Now?
The answer to this question depends entirely on what kind of investor you are.
If you are a short-term trader calibrating positions to the July 28–29 FOMC meeting, the next PCE print, or September’s rate hike probability, nothing in this article changes your calculus. That is a timing game, and it remains legitimately uncertain.
If you are a long-term physical metals holder focused on 3-to-5-year purchasing power protection, the current environment presents a specific kind of opportunity. Gold is sitting near $4,000 — roughly $1,600 below its January all-time high — while the structural forces that drove it there remain intact. Central banks are still buying. The federal debt load is still expanding. The geopolitical order is still fragmenting. Real yields are elevated but are constrained by the same fiscal ceiling that limits the Fed’s ability to tighten indefinitely.
In that environment, dollar-cost averaging — building a position gradually through Q3 2026 rather than timing a single entry — is a rational strategy. Specifically, this consolidation window allows investors to accumulate physical metal while the paper market works through its liquidation cycle. History consistently shows that the best entry points for physical metal are rarely heralded by optimistic headlines.
Furthermore, the FOMC meeting on July 28–29 is widely expected to be a hold. The structural setup — a Fed that cannot tighten aggressively because of Treasury market dynamics, combined with central banks that continue buying regardless of price — is not resolved by a single rate decision.
HSBC’s Willem Sels and Lucia Ku put it plainly: “Demand for portfolio diversification, central bank buying and steady ETF inflows should support gold prices over the medium term. We continue to view gold as an effective diversifier against broader portfolio risks.” [Reuters]
That is not a call to buy. It is an acknowledgment that the structural case for gold has not changed. For investors who already understand why they own precious metals, it is a reminder to stay the course.
Stay On Top of Gold & Silver Prices
Get important market alerts sent straight to your inbox.
People Also Ask
What is HSBC’s gold price forecast for 2026?
HSBC’s Chief Precious Metals Analyst James Steel revised the bank’s 2026 average gold forecast to $4,560 per ounce on July 9, 2026, down from a prior estimate of $4,864. However, HSBC left its year-end 2026 target unchanged at $4,750 and its 2027 year-end target at $5,025. The bank expects gold to trade between $3,800 and $4,700 for the remainder of the year before closing near the $4,750 target. Its longer-term 2028 and 2029 forecasts of $5,200 and $5,300 were not revised. [Reuters]
Why is gold falling if central banks are still buying?
Gold faces near-term pressure from two cyclical forces: elevated US real yields (which raise the opportunity cost of holding non-yielding assets) and a stronger US dollar (which makes dollar-priced gold more expensive for overseas buyers). These forces currently dominate short-term price action. However, central bank demand — 244 tonnes in Q1 2026 alone — continues to provide a structural price floor that is not correlated with interest rate sentiment. The institutional and retail buying that has driven gold’s multi-year bull market has not reversed. [World Gold Council]
Is the gold-silver ratio at 70:1 a buying signal for silver?
At approximately 70:1, the gold-silver ratio sits above its 50-year historical average of roughly 65. Historically, ratios above this level have corresponded to periods of relative silver undervaluation. The Silver Institute confirms a sixth consecutive annual supply deficit for 2026 at 46.3 million ounces, with cumulative drawdowns since 2021 reaching 762 million ounces. However, the ratio does not provide a precise timing signal — a catalyst such as a Fed policy shift or industrial demand recovery would likely be needed to trigger meaningful compression toward historical norms. [Silver Institute]
Should I buy gold during a price correction?
Whether to purchase physical gold during a correction depends on your investment horizon and portfolio goals. For long-term investors focused on purchasing power preservation over 3 to 5 years, corrections in a structural bull market have historically provided favorable entry points. Dollar-cost averaging — spreading purchases across multiple price levels rather than timing a single entry — reduces timing risk while maintaining exposure to the long-term structural case. For shorter-term traders, price timing remains uncertain and depends on macro variables including Fed policy and geopolitical developments.
The Second Corner: What the Mainstream Is Missing
The mainstream read on gold in mid-2026 is a story about a broken trade. The record high was January. The correction has been steep. The Fed is hawkish. The thesis is done.
Here is what that reading misses.
The forces that drove gold from approximately $2,600 in late 2024 to $5,589.38 in January 2026 were not built on low rates alone. They were built on a structural recognition, years in the making, that the monetary system’s architecture is under long-term pressure. Central banks set a 70-year record for annual gold purchases in 2022 and have sustained purchases above 800 tonnes every year since — more than double the pre-2022 historical average. [World Gold Council] Sovereign debt loads have expanded at a rate that makes extended tightening arithmetically self-defeating — the interest burden consumes the fiscal space required to sustain it.
None of that has been revised. Not by HSBC, or the central banks still buying at 244 tonnes per quarter. Not by the six-year silver deficit that compounds silently regardless of what the Fed does at its July meeting.
The near-term headwinds are cyclical. The structural drivers are not. When those two timeframes reconcile — and historically, they always do — the investors who accumulated physical metal during the consolidation will have the better entry. That is not gold-bug rhetoric. That is HSBC’s own analysis, with the year-end target as the evidence.
SOURCES1. Reuters via Yahoo Finance — HSBC cuts 2026-27 gold price forecasts on hawkish Fed tilt, July 9, 20262. World Gold Council — Gold Demand Trends Q1 2026, April 29, 20263. World Gold Council — Gold ETF Flows, June 20264. Silver Institute — World Silver Survey 2026, April 15, 20265. FXStreet — HSBC: Gold range-bound near term, upside later, July 1, 20266. MacroMicro — US 10-Year Treasury Yield, July 20, 20267. GoldSilver — HSBC Cut Its Gold Forecast by $304. Then Said Gold Will Hit $4,750 by Year-End, July 10, 20268. ExchangeRates.org.uk — HSBC Says Sell-Off May Be Nearing An End, June 30, 2026
Disclaimer: This article is for informational purposes only and does not constitute financial or investment advice. Always consult a qualified financial adviser before making investment decisions.
You May Also Like:
Source link