Published: 07-20-2026, 09:31 am | Updated: 07-20-2026, 02:45 pm
Oil is up 3% this morning. Under normal circumstances, that single fact would be enough to send silver lower — and most traders know exactly why. However, the silver price today is doing the opposite.
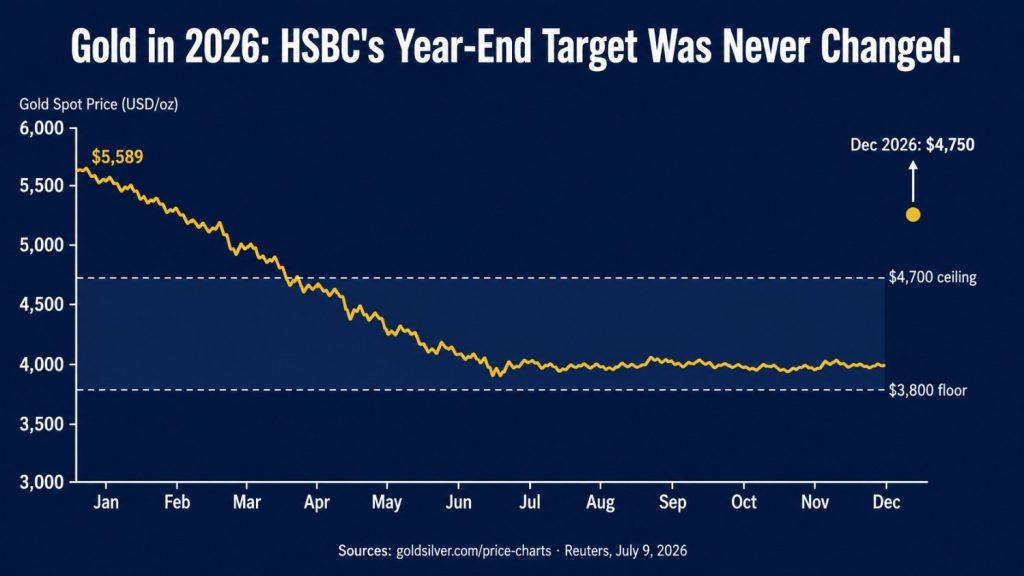
Silver’s spot price of $56.87 is up 1.55%, while gold’s spot price of $4,013 is essentially flat, off just 0.15%. Meanwhile, WTI crude is up roughly 2.5% near $85 a barrel and Brent has pushed above $90. [GoldSilver price charts, July 20, 2026]
Two numbers are moving in directions that normally cancel each other out. The reason they don’t today is more useful to understand than the moves themselves.
Why Does Rising Oil Usually Push Silver Lower?
The chain works in four steps. First, oil prices surge — often on a geopolitical event, as happened over the weekend when the U.S. completed its ninth consecutive night of strikes on Iran. Second, higher oil lifts headline inflation. Third, elevated inflation raises the probability that the Federal Reserve will hike interest rates. Fourth, a higher-rate environment increases the cost of holding non-yielding assets like silver and depresses industrial growth expectations — which directly cuts demand for the metal.
Silver is particularly vulnerable to that fourth step because of silver’s two-engine demand structure: roughly 58% of annual silver consumption is industrial — solar panels, semiconductors, EV components — while the remaining 42% is monetary. [Silver Institute, World Silver Survey 2026] When the Fed’s rate path turns threatening, both engines get hit simultaneously. Gold, by contrast, runs almost entirely on monetary demand, which is why gold tends to hold better in those moments.
That mechanism played out exactly as expected throughout most of July. Silver dropped more than 7% last week as airstrikes intensified and oil climbed. So why is it running the other direction today?

The Edge Every Investor Needs Smarter precious metals investing starts here. The Nuggets Newsletter brings you essential market insights, Fed updates, global trends, educational videos, and much more.
What Changed Today? Why Is Silver Ignoring the Oil Spike?
The answer lies not in the oil news, but in what markets have already priced into the Federal Reserve’s next meeting. The FOMC convenes July 28 and 29 — just nine days away. As of Friday’s close, CME FedWatch put the probability of a rate hold above 85%. [CME Group FedWatch Tool, July 18, 2026] That number is high enough that markets have effectively resolved the July hike question: it is not happening. Furthermore, June CPI came in at 3.5% year-over-year — sharply down from May’s 4.2% — which is the data that locked in that hold expectation in the first place. [Bureau of Labor Statistics, July 2026]
Consequently, today’s oil spike is not landing with the same force on silver’s industrial engine. When traders already know the July meeting is a hold, a single session of crude oil gains doesn’t move the rate-hike calculus meaningfully. Instead, silver’s industrial-demand floor is holding, and its monetary engine is benefiting from a weaker dollar — down slightly on the day despite the oil move. The result is a metal that looks like it’s ignoring inflation. In fact, it has simply already processed the most important piece of the inflation story.
What Does the Gold-Silver Ratio Tell Us Right Now?
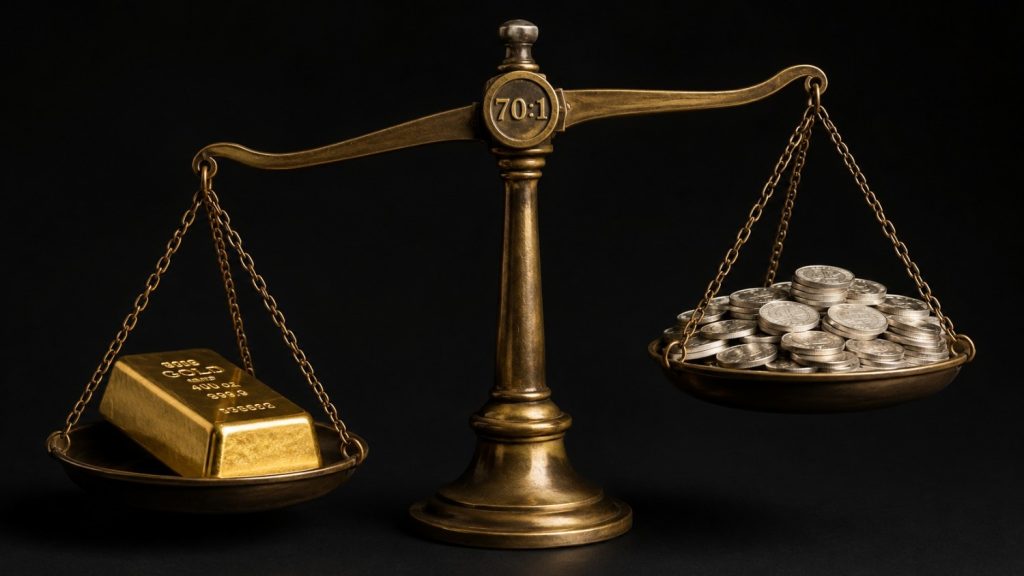
The gold-silver ratio — the number of silver ounces required to buy one ounce of gold — has been one of the most useful signals in 2026. Today it is falling, dropping from 71.77 on Friday to approximately 70.6 as of midday. That compression reflects silver outrunning gold, which is exactly what happens when the industrial engine starts reactivating relative to the prior suppressed state. [FXStreet, July 20, 2026]
For context, the ratio reached approximately 55:1 in May 2026 before the hawkish Fed repricing of June and July stretched it back toward 72. A 50-year historical average of roughly 65:1 means silver is still historically cheap relative to gold at current levels. Moreover, the physical market confirms that assessment: the Silver Institute’s World Silver Survey 2026 projects a sixth consecutive annual supply deficit of 46.3 million ounces for 2026 — a structural tightness that the paper market has been overriding during the rate-anxiety phase. [Silver Institute / Metals Focus, April 2026]
What Should Long-Term Silver Holders Understand About Today’s Move?
Today’s divergence is a reminder that silver’s behavior is not random — it is mechanically predictable once you understand its two demand engines. Rate anxiety suppresses the industrial engine. Rate clarity restores it. In the near term, the July meeting is already priced. However, September is not: markets still assign meaningful probability to a September hike, which is why silver remains range-bound rather than staging a full recovery.
Nevertheless, the structural floor is not going away. Six consecutive years of supply deficits mean the physical market is drawing down above-ground stocks at a rate the mining industry cannot offset. That fundamental tension doesn’t respond to a single Fed meeting — it responds to the cumulative weight of real demand exceeding real supply, month after month. Today’s session is not a breakout. It is, however, a demonstration that the suppression trade has limits. When the rate question resolves, the physical reality steps back in.
What to Watch Before the FOMC Decision
Two dates now define silver’s near-term setup. First, the FOMC decision on July 29 — a hold is near-certain at this point, and what matters most will be Chair Warsh’s press conference language on September. Any signal that September is live will push the ratio back toward 71 or higher. Second, June PCE data arrives July 30, the day after the decision. PCE is the Fed’s preferred inflation gauge; a soft print would reinforce the hold narrative and likely compress the ratio further. [Federal Reserve, CME Group FedWatch]
In the meantime, Iran and the Strait of Hormuz remain the wildcard. The conflict is now in its fifth month, and Washington launched its ninth consecutive night of airstrikes over the weekend. So long as Hormuz disruption keeps oil elevated, headline inflation stays sticky — and the Fed’s room to pivot stays narrow. That is the constraint on silver’s recovery timeline. It is not a constraint on silver’s structural case, which is driven by physical supply and demand over a horizon measured in years, not weeks.
Stay On Top of Gold & Silver Prices
Get important market alerts sent straight to your inbox.
SOURCES1. GoldSilver — Live Silver Spot Price, July 20, 20262. GoldSilver — Live Gold Spot Price, July 20, 20263. Silver Institute / Metals Focus — World Silver Survey 2026 & Sixth Consecutive Annual Market Deficit Outlook, April 15, 20264. Bureau of Labor Statistics — Consumer Price Index Summary, June 20265. CME Group — FedWatch Tool, July 2026 FOMC Hold Probability, July 18, 20266. FXStreet — Silver Price Today: Silver Rises, July 20, 2026
Disclaimer: This article is for informational purposes only and does not constitute financial or investment advice. Always consult a qualified financial adviser before making investment decisions.
You May Also Like:
Source link