Published: 07-20-2026, 04:28 pm
Key Takeaways
JPMorgan cut its Q4 2026 gold forecast by 25% to $4,500/oz on July 3, down from a $6,000 target issued June 9. The bank now projects $4,300 as the Q3 average.The mechanism driving the cut is near-term rate sensitivity: JPMorgan quantifies that gold has dropped approximately $20/oz for every 1 basis point rise in 10-year real yields since late February.The downside scenario — gold breaking below $4,000 and testing $3,500–$3,600 — requires both hotter summer economic data AND an early Fed rate hike. It is not JPMorgan’s base case.JPMorgan’s long-term structural thesis remains fully intact. The bank explicitly projects a renewed upward cycle in 2027 driven by central bank diversification and real yield normalization.Wall Street is divided: Goldman Sachs ($4,900), BofA ($4,800), Deutsche Bank ($4,800), and UBS ($5,200 over 12 months) all sit above JPMorgan’s Q4 target. Morgan Stanley’s upside scenario is $5,200 for H2, with a base case near $4,400.For silver, JPMorgan projects $60–$65/oz as the market normalizes from 2025’s tight supply conditions. Platinum: ~$1,800/oz by year-end. Palladium: $1,350/oz by year-end.
On June 9, 2026, JPMorgan told clients that gold would hit $6,000 an ounce by year-end. Twenty-four days later, the same bank cut that target by 25% to $4,500.
That revision generates a specific kind of noise: headlines that either catastrophize the cut (gold is broken) or dismiss it entirely (banks get forecasts wrong all the time). Neither framing helps investors make a decision.
What matters is the mechanism. Why did JPMorgan cut? What would need to happen for the downside scenario to trigger? And does any of this change the structural case for holding physical precious metals? The answers are more precise — and more useful — than the headlines suggest.
Why Did JPMorgan Cut Its Gold Forecast?
JPMorgan’s July 3 note cited two converging factors: weaker demand from key buying sectors, and a sharp re-emergence of gold’s sensitivity to real interest rates. [Reuters, July 3, 2026]
The demand side is real. JPMorgan revised its full-year 2026 gold ETF forecast from net inflows of 400 tonnes to net outflows of 50 tonnes — a 450-tonne swing. Central bank net buying guidance fell from 640 tonnes to 600 tonnes. Bar and coin demand growth dropped from +10% year-over-year to +3.6%. [JPMorgan, via AllWeatherFinance]
The rate sensitivity side is more precise. Since late February 2026, JPMorgan estimates that for every 1 basis point rise in the US 10-year real yield, gold has fallen approximately $20 per ounce — around 0.4%–0.5%. The Warsh FOMC shock reestablished it. Gold’s negative correlation with real yields is firmly back. [JPMorgan, via AllWeatherFinance / BigGo Finance]
That context matters. Federal Reserve Chair Kevin Warsh chaired his first FOMC meeting on June 17, 2026. The Fed held rates unchanged at 3.50%–3.75%, but the meeting delivered a hawkish surprise: 9 of the 18 members who submitted dot plot projections indicated at least one rate hike in 2026, while the remaining 9 projected rates unchanged or lower. [Yahoo Finance, June 17, 2026] Warsh also withheld his own dot plot projection entirely — the first Fed chair ever to do so. He simultaneously announced the elimination of forward guidance — no more pre-signaling of rate moves. [CNN, June 17, 2026]
Markets read that combination as hawkish. Real yields moved higher. Because gold’s pricing has reconnected to the real yield mechanism, higher real yields became a direct ceiling on the metal’s price. That is the core of what JPMorgan’s revision is measuring.
The Knowledge That Changes Everything
2 Free Guides
Two essential guides — yours free. Understand why gold matters and why fiat currencies always fail.
What Does JPMorgan’s New Gold Price Target Actually Mean?
JPMorgan now projects gold averaging $4,300 per ounce through Q3 2026, rising to $4,500 per ounce in Q4. The bank describes the near-term setup as range-bound. [Reuters, July 3, 2026]
Per ounce forecasts as of July 2026. JPMorgan cut 25% on July 3; others have not followed.
JPMorgan (subject of article) Other major banks
Gold price targets: JPMorgan $4,500 · Goldman Sachs $4,900 · BofA $4,800 · Deutsche Bank $4,800 · Morgan Stanley $5,200 (upside) · UBS $5,200 (12-month).
Those numbers put JPMorgan at the bearish end of a wide Wall Street range. Goldman Sachs projects gold reaching $4,900 by Q4 2026. Bank of America sees $4,800 by the same period. Morgan Stanley has an upside target of $5,200 for the second half of 2026, conditional on stronger ETF inflows materializing; its base case sits closer to $4,400. UBS projects $5,200 over the next 12 months. Deutsche Bank calls $4,800 by Q4. [TheStreet, Yahoo Finance, July 2026]
How Wide Is the Wall Street Disagreement?
That $700-per-ounce spread is one of the widest institutional disagreements on gold in recent years. The same macro facts, interpreted differently, yield a $700-per-ounce gap. That spread alone is worth understanding before acting on any single forecast. For a broader view of how Wall Street’s forecast divergence has evolved, see our earlier analysis of Goldman’s cut and JPMorgan’s divergence.
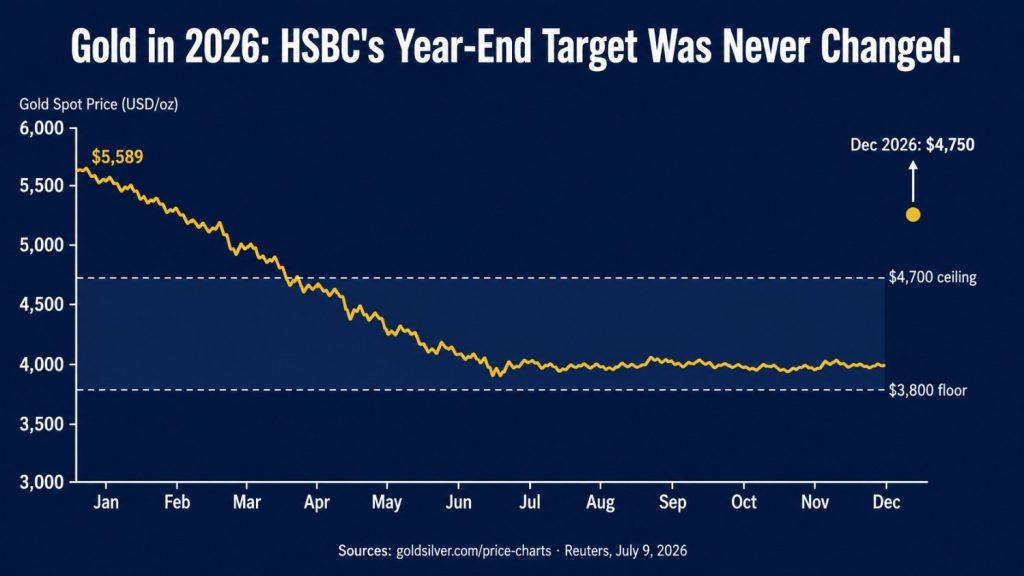
To understand where gold’s spot price sits relative to these targets, consider that gold currently trades around $4,007–$4,043 (as of July 20–21, 2026) — already below JPMorgan’s own Q3 average projection. The metal peaked at $5,589.38 intraday on January 28, 2026, and has since corrected approximately 28%.
Could Gold Really Fall to $3,500?
JPMorgan’s report identifies a downside scenario: if summer economic data continues to run hot, strengthening the case for an earlier Fed rate hike, gold faces a risk of decisively breaking below $4,000 per ounce. That break, the bank notes, could trigger technical stop-losses and momentum selling, pulling prices into the $3,500–$3,600 range. [JPMorgan, via BigGo Finance / AllWeatherFinance]
However, two conditions must occur together for this scenario to trigger. First, summer economic data must come in hotter than expected. Second, the Fed must move to hike rates sooner than the market currently prices. JPMorgan’s own base case does not call for a 2026 rate hike. The bank’s rate strategy team expects the Fed to hold in 2026, with the first hike delayed to Q3 2027. [JPMorgan, via AllWeatherFinance]
The OIS forward curve, as of early July, was pricing approximately 40 basis points of cumulative hikes through April 2027 — more hawkish than JPMorgan’s base case, but not a certainty. Market probabilities shift with each data release. The next major inputs are the FOMC meeting on July 28–29 and June PCE data on July 30.
To put the conditional framing plainly: the $3,500–$3,600 scenario is the tail risk, not the central expectation.
What Is JPMorgan’s Long-Term Gold Outlook?
Despite the sharp near-term revision, JPMorgan explicitly maintains its long-term bullish thesis on gold. The bank projects a renewed upward cycle beginning in 2027, driven by three structural forces: persistent geopolitical fragmentation, central bank reserve diversification away from fiat currencies, and the eventual normalization of real interest rates. [Reuters / Yahoo Finance, citing JPMorgan]
Here is the mechanism worth internalizing. The same sensitivity that subtracts $20 per ounce for each basis point of yield increase adds $20 per ounce when yields fall. If inflation falls and the Fed resumes cutting in 2027, or if the US growth picture deteriorates and long-term yields compress, the math flips. JPMorgan’s cut is, in that sense, an argument for a lower entry point before the next leg — not an argument that the structural thesis has changed.
The structural thesis remains grounded in three forces that drove gold from below $2,000 in 2023 to $5,589 in January 2026. First, central bank reserve diversification. Second, the accumulation of US sovereign debt. Third, the erosion of confidence in fiat-denominated reserves among non-Western central banks. JPMorgan’s revision does not touch any of those factors. It is a near-term adjustment to a rate-driven cap, not a structural reversal.
How Does JPMorgan’s Silver Forecast Change?
JPMorgan also updated its silver outlook as part of the same report, projecting silver to average between $60 and $65 per ounce over its forecast horizon. [Reuters, July 3, 2026]
The bank’s reasoning cites two factors. The silver market is moving away from the exceptionally tight physical supply conditions of 2025, and the gold-to-silver ratio is expected to normalize. At current silver prices of roughly $56.53 (July 20, 2026), JPMorgan’s $60–$65 range implies meaningful recovery — but significantly below the highs the metal reached earlier in 2026.
For a deeper look at silver’s structural position, see our July 2026 silver price outlook.
The broader silver picture warrants context beyond JPMorgan’s note. Silver’s industrial demand constitutes approximately 58% of total consumption. [Silver Institute, WSS 2026] On the solar manufacturing side, photovoltaic producers have been reducing silver intensity per panel — BloombergNEF estimates solar silver demand fell roughly 7% year-on-year in 2026, as manufacturers accelerated substitution and efficiency improvements in response to elevated silver input costs. This is demand normalization, not a structural collapse.
What JPMorgan is projecting for silver is not a broken market but a market stabilizing after the supply-deficit-driven premium of 2025 normalizes. The silver market ran a confirmed supply deficit for five consecutive years through 2025. [Silver Institute, WSS 2026] Current data puts it on track for a sixth. JPMorgan’s $60–$65 range represents a calmer market, not an abandoned one.
What Are JPMorgan’s Platinum and Palladium Forecasts?
JPMorgan extended its revised outlook across the full precious metals complex. The bank expects platinum to average approximately $1,800 per ounce by year-end 2026, rising to around $1,950 per ounce by end-2027, supported by supply-side fundamentals in South Africa. For palladium, JPMorgan forecasts $1,350 per ounce by end-2026 and expects it to average around $1,300 per ounce in 2027, in line with broader weakness across the complex. [Reuters, July 3, 2026]
The full precious metals picture is consistent: JPMorgan sees a near-term cap across every metal driven by the same rate-sensitivity mechanism, followed by a structural recovery as that mechanism reverses.
What Does This Mean for Long-Term Precious Metals Holders?
JPMorgan’s forecast revision is a near-term adjustment, not a thesis change. The bank is responding to a specific, quantifiable mechanism — real yield sensitivity — that functions cyclically, not permanently. It openly forecasts the mechanism reversing in 2027.
For long-term holders, the relevant question is not whether JPMorgan’s Q3 target of $4,300 turns out to be accurate. The relevant question is whether the structural forces that have driven central bank gold accumulation — geopolitical fragmentation, reserve diversification, fiscal expansion, the multi-decade erosion of dollar confidence among non-Western holders — have changed in any meaningful way.
JPMorgan’s own research says they have not.
Wall Street’s forecast divergence runs more than $700 per ounce wide. That spread reflects genuine uncertainty about the near-term rate path — not a consensus view that gold’s structural role has diminished. When the rate environment normalizes, the five largest banks in the world will not be arguing about whether gold belongs in a portfolio. They will be arguing about how high it goes.
Stay On Top of Gold & Silver Prices
Get important market alerts sent straight to your inbox.
People Also Ask
Why did JPMorgan cut its gold price forecast for 2026?
JPMorgan cut its Q4 2026 gold forecast by 25% to $4,500 per ounce on July 3, 2026, citing two factors: weaker-than-expected demand from key buying sectors including ETFs and central banks, and a sharp re-emergence of gold’s sensitivity to US real interest rates. The bank quantified that gold has dropped approximately $20 per ounce for every 1 basis point rise in the 10-year real yield since late February 2026. The revision followed Fed Chair Kevin Warsh’s hawkish debut FOMC meeting on June 17, which caused real yields to move higher and reasserted the negative correlation between gold and real rates.
What is JPMorgan’s current gold price target for Q3 and Q4 2026?
JPMorgan projects gold averaging $4,300 per ounce through Q3 2026, rising to $4,500 per ounce by Q4 2026. This represents a roughly 25% reduction from the bank’s prior Q4 target of approximately $6,000, which it issued on June 9, 2026.
Could gold fall to $3,500 per ounce?
JPMorgan identified $3,500 to $3,600 per ounce as a tail-risk scenario, not a base case. Two conditions must occur simultaneously for this scenario to trigger: summer economic data must run hotter than expected, and the Federal Reserve must move to hike interest rates earlier than currently anticipated. JPMorgan’s own base case does not call for a 2026 Fed rate hike; the bank expects the first hike in Q3 2027. The downside scenario would require a break below $4,000 to trigger technical stop-losses and momentum selling.
Does JPMorgan still have a long-term bullish view on gold?
Yes. Despite the near-term forecast cut, JPMorgan explicitly maintains its long-term bullish structural thesis on gold. The bank projects a renewed upward cycle beginning in 2027, driven by persistent geopolitical fragmentation, central bank reserve diversification away from fiat currencies, and the eventual normalization of real interest rates. The near-term downgrade reflects a cyclical rate-sensitivity headwind, not a change to the multi-year structural drivers.
How does JPMorgan’s gold forecast compare to other major banks?
JPMorgan’s $4,500 Q4 2026 target is the most bearish among major Wall Street institutions. Goldman Sachs projects $4,900 by Q4 2026; Bank of America forecasts $4,800; Deutsche Bank also calls $4,800; Morgan Stanley’s upside target is $5,200 for the second half of 2026 (base case near $4,400); and UBS projects $5,200 over the next 12 months. The spread between JPMorgan and the upper end of forecasts is approximately $700 per ounce — one of the widest institutional forecast divergences for gold in recent memory.
SOURCES1. Reuters: “JPMorgan sees $4,500 gold price in fourth quarter, says risks to downside,” July 3, 2026 (via KFGO, Mining Engineering Online)2. AllWeatherFinance: “JPMorgan Warns: If the Federal Reserve Raises Interest Rates Early, Gold Prices May Fall Below $4,000 Again or Even Test $3,500–$3,600,” July 20263. BigGo Finance: “JPMorgan Warns Gold Could Slide to $3,600 as Fed Rate-Hike Expectations Reshape Pricing Logic,” July 20264. Yahoo Finance: “Warsh Hawkish Shock: 9 Fed Officials Signal 2026 Rate Hike,” June 17, 20265. CNN: “Warsh Promises a New Vision for the Fed, as His Colleagues Eye a Rate Hike,” June 17, 20266. TheStreet: “JPMorgan Cuts Gold Forecast as Fed Risks Rise,” July 5, 20267. TheStreet: “JPMorgan Sees the Writing on the Wall for Silver Stock Investors,” July 20268. Silver Institute / Metals Focus: World Silver Survey 2026, April 15, 20269. BloombergNEF: Silver demand from solar installations forecast, 202610. Chase: “What Happened at Kevin Warsh’s First Fed Meeting as Chair? 3 Key Takeaways,” June 18, 2026
Disclaimer: This article is for informational purposes only and does not constitute financial or investment advice. Always consult a qualified financial adviser before making investment decisions.
You May Also Like:
Source link